 |

| Home | Overview | Browser | Access | Cookbook | Links | Credits |
|
The Field 287 analysis tool.
A specialist Graphical User Interface is available to aid exploration of the Field 287 database. It can be launched from here (N.B.: the tool requires Java 1.6 or later). The tool offers simple push-button functionality under three broad headings:- General - summarises various statistical properties of the dataset, including ranges of attributes and typical photometric errors;
- Sample selection - defines sample selection criteria by position, variability or classification as a known QSO etc, tabulating sample selections and allowing plotting of light-curves;
- Source specific - allows detailed visualisation of light curves and colour curves for individual objects identified by position or source identifier
Example usage: plot B-band light curves for a sample of known QSOs lying within 20 arcminutes of a given position, and then select one object for which to plot full UBRI light and U-B, B-R and R-I colour curves:
- Launch the tool (if
downloading and saving locally, invoke on the command line using
java -jar F287_Analysis_Tools.jar .): a pop-up window appears with 3 options. - Press the "Sample Selection" button and click "OK: a new control panel pops up."
- Press "KnownQSO Sample Selection", passband "B (Blue)", select the sexagesimal tab and enter "21 40 00.0" for RA and "-45 00 00.0" for Dec with "Angular radius" 1200 arcsec (=20 arcmin); click on "Generate": after a short time a results table pops up with 8 quasars.
- Click on any object in the results table, for example "Q 2135-4530" (Spectroscopic redshift 0.308) and then click on "Generate Light Curve": a plot of the B band magnitude versus time pops up.
- Note that this object has source ID 310912; click "Back" on the sample selection control panel to return to the top-level panel, and this time select "Source Specific" to pop-up that control panel.
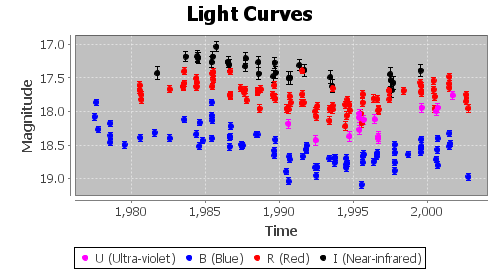
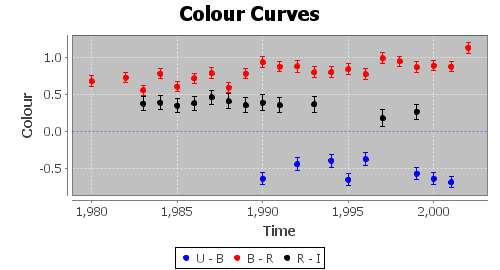
- Input 310912 into "Source ID" in the direct search box; select all passbands (UBRI); select class "Star" for point-source magnitudes; and finally in the plots pane select all options for light curves and colour curves from all available passbands along with error bars.
- Click on "Generate": two new plots will pop up (move the colour plot aside to see the light curves beneath).
Home | Overview | Browser | Access | Cookbook | Links | Credits
Radial | MenuQuery | FreeSQL | CrossID
WFAU, Institute for Astronomy, mar@roe.ac.uk
Royal Observatory, Blackford Hill
Edinburgh, EH9 3HJ, UK
16/7/2015